We’ve all read the recent headlines. Since late 2015, sentiments have changed in the marketplace lending sector and investors have expressed concern. As an independent risk analytics platform, MonJa is often asked its if credit quality is deteriorating in the marketplace lending space and if investors need to readjust their expectations about the quality of loans that the platforms are originating.
In order to do that, we need to dive past the FICO score and into the characteristics of the various vintages and grades of loans themselves.
In The Last Five Years, FICO Scores Have Shown Consistency.
Compiled Loan Data (All Grades) from 2011- 2015: FICO Range, DTI, Annual Income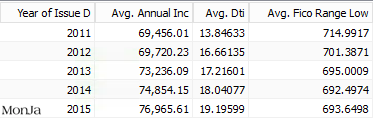
To begin our analysis, I want to make a note that I will be analyzing more recent vintages (Y13-Y15). On the surface, we can see that the platforms have done a remarkable job at keeping the FICO scores of the loans that they issue almost constant. The average FICO score of marketplace loans issued between 2013-2015 remained between 692-695.
When we look deeper in the charts below, we can see that the average FICO scores of loans in Low-Risk Tiers* also remained fairly constant; FICO scores remained between 697-699 in 2013-2015. Similarly, the FICO scores of lower rated D-G rated loans stayed in a very tight range of 681-682 over the same 2013-2015 period.
But Debt to Income Gives A Fuller Picture.
Debt to Income Ratio: Low-Risk Tiers Loans
Let’s take a look at Low-Risk Tiers Loans first. When looking deeper into the data we can see that the debt to income ratio of the higher rated Low-Risk Tiers loans did show some deterioration from 17% in 2013 to more than 18% in 2015.
Data of Low-Risk Tiers: Average income increased, average DTI increased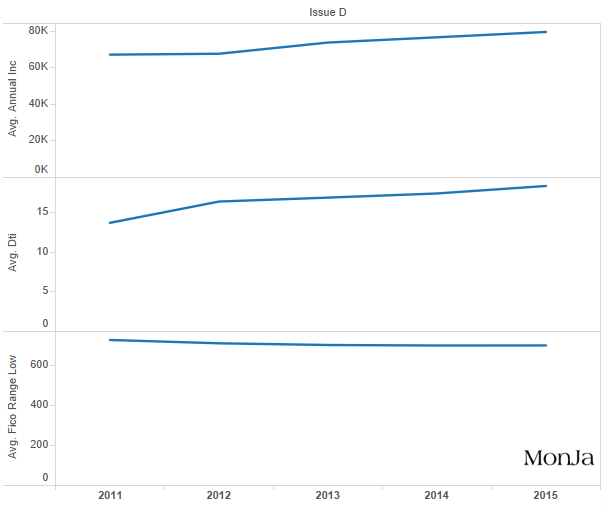
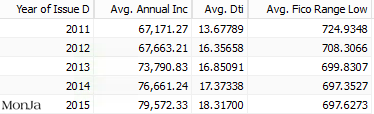
Interestingly, this movement was offset with significantly higher annual incomes in this sub-section of the market. Here are some key takeaways:
- Average Incomes rose substantially from $73,791 in 2013 to $79,572 in 2015.
- Since the debt to income ratio rose in the face of rising incomes, we can estimate that the average debt balance for Low-Risk Tiers borrowers rose more than 20% — from $12,604 in 2013 to over $15,277 in 2015.
- We can surmise from the data that the platforms are skewing their higher ratings towards loans originated from more heavily indebted, but higher income individuals.
MonJa Analysis: We believe that these metrics will likely not lead to higher delinquencies amongst the Low-Risk Tiers rated borrowers, as these individuals will be able to support higher loan balances with their extra income.
Debt to Income Ratio: High-Risk Tiers Loans
We see a very different trend with the data from the lower rated High-Risk Tiers borrowers. We have seen that the platforms have loosened their standards for the High-Risk Tiers borrowers, despite maintaining FICO relatively stable FICO scores for these loans.
Data of High-Risk Tiers: Average income decreased, average DTI increased
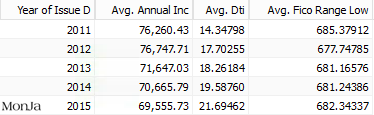
Here are our key takeaways for High-Risk Tier borrowers:
- The average debt to income levels has crept higher, from 18.26% in 2013 to over 21.69% in 2015.
- Additionally, the average income of these borrowers has dropped from $71,647 in 2013 to $69,555 in 2015.
- This suggests that the platforms are originating lower quality loans that they were in years past — and that the borrowers have less capacity to repay those loans.
MonJa Analysis: We believe that the uptick that we see in delinquencies has primarily arisen from the looser origination standards that occurred in 2015 from these lower rated loans.
Conclusion
While marketplace lending delinquencies can be attributed to market fluctuations, investors need to dig beneath the surface to understand true causes. While FICO scores show consistency, debt to income ratios and delinquencies vary depending on loan grades. Origination standards are also a cause of delinquencies. As more investors move into marketplace lending and construct their portfolio, it’s necessary to consider various factors in their loan selection strategy.
* We define Low-Risk Tiers as the first 3 tiers of consumer lending platforms assigning risk grades, (e.g. A-B-C or AA-A-B)